

Reviewing the right financial reports every month is the difference between reacting to cash shortfalls and preventing them. A consistent monthly reporting routine turns your bookkeeping data into a clear picture of where the business is earning, spending, and building value.
In this guide, we walk through the essential reports we review with small business owners each month, what to look for in each, and how to use them to make confident decisions before small issues become large ones.

The Core Financial Statements
Three statements form the foundation of every monthly review. Together they answer three questions: Is the business profitable? What does the business own and owe? Where is cash actually moving? Reviewing them together prevents the common mistake of looking at profit alone while missing a cash crunch.
Income Statement (Profit and Loss)
The income statement shows revenue, direct costs, and operating expenses over the month. We look at this first because it reveals whether the core business model is generating profit before financing and tax considerations.
- Total revenue: Compare month-over-month and year-over-year to spot growth or decline early.
- Cost of goods sold or direct costs: Track as a percentage of revenue to catch margin erosion from supplier price changes or inefficiency.
- Operating expenses: Review each category (rent, payroll, marketing, software) to ensure no line item is creeping above expectations.
- Net profit: The bottom line after all expenses; a positive net profit should still be reconciled with cash flow.
Balance Sheet
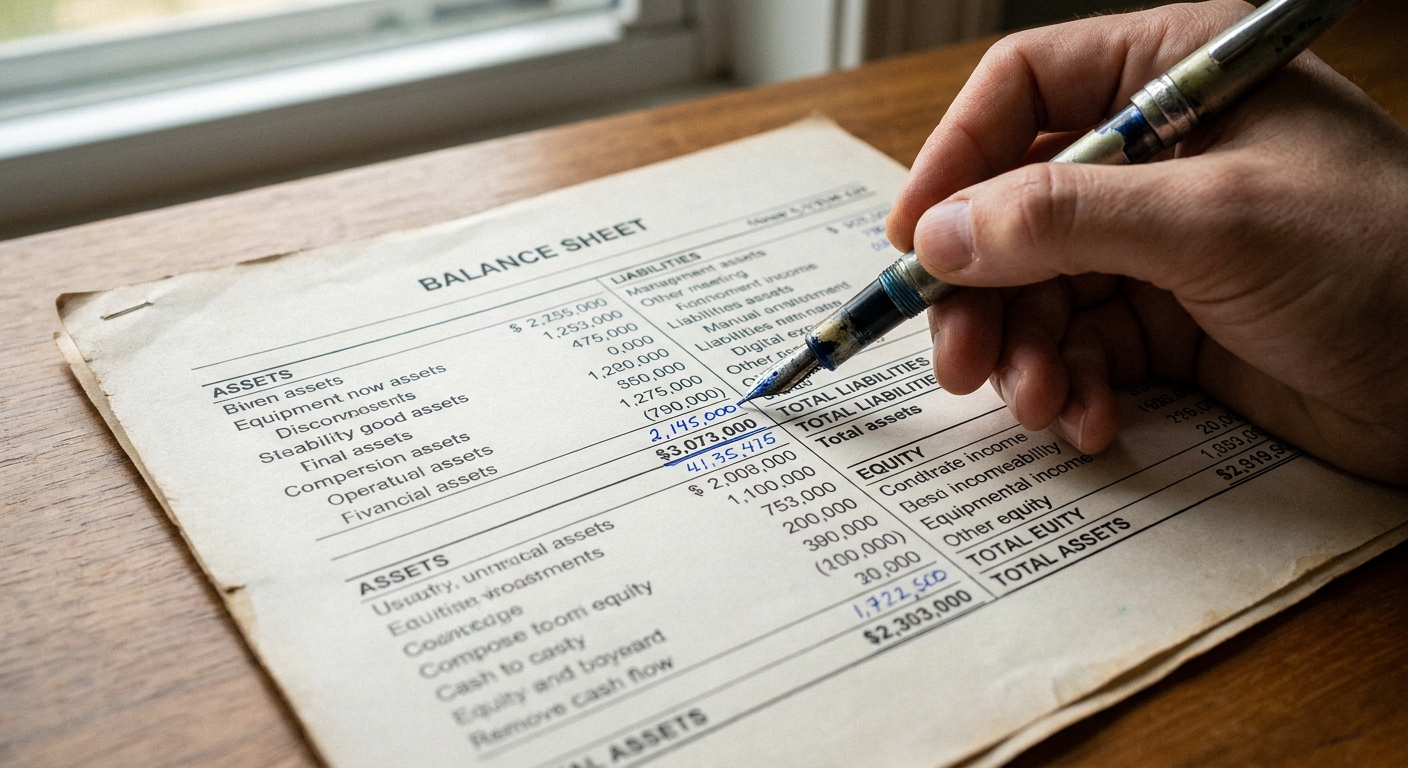
The balance sheet is a snapshot at month-end showing what the business owns, what it owes, and the owner’s equity. It is the report that reveals solvency and the true financial position beyond monthly profit.
- Assets: Check cash and accounts receivable balances; ensure inventory levels are appropriate and not tying up excess cash.
- Liabilities: Watch for growing short-term debt, such as credit card balances or supplier payables, which can signal cash pressure.
- Owner’s equity: Track retained earnings and owner’s draws; increasing equity is a sign the business is building lasting value.
Cash Flow Statement
Profitability does not always equal cash in the bank. The cash flow statement shows the actual movement of cash from operations, investing, and financing during the month. We use it to identify timing gaps between earning revenue and collecting cash.
- Operating cash flow: Cash generated from day-to-day business; this should be positive and cover fixed obligations.
- Investing cash flow: Cash spent on equipment or received from asset sales; large outflows here need to be planned against operating cash.
- Financing cash flow: Loan proceeds, repayments, and owner contributions; monitor whether the business is relying too heavily on debt to fund operations.
Cash Management and Reconciliation Reports
Even profitable businesses fail when cash is tied up in unpaid invoices or when records do not match the bank. These reports keep cash moving and protect against errors and fraud.
Accounts Receivable Aging Report
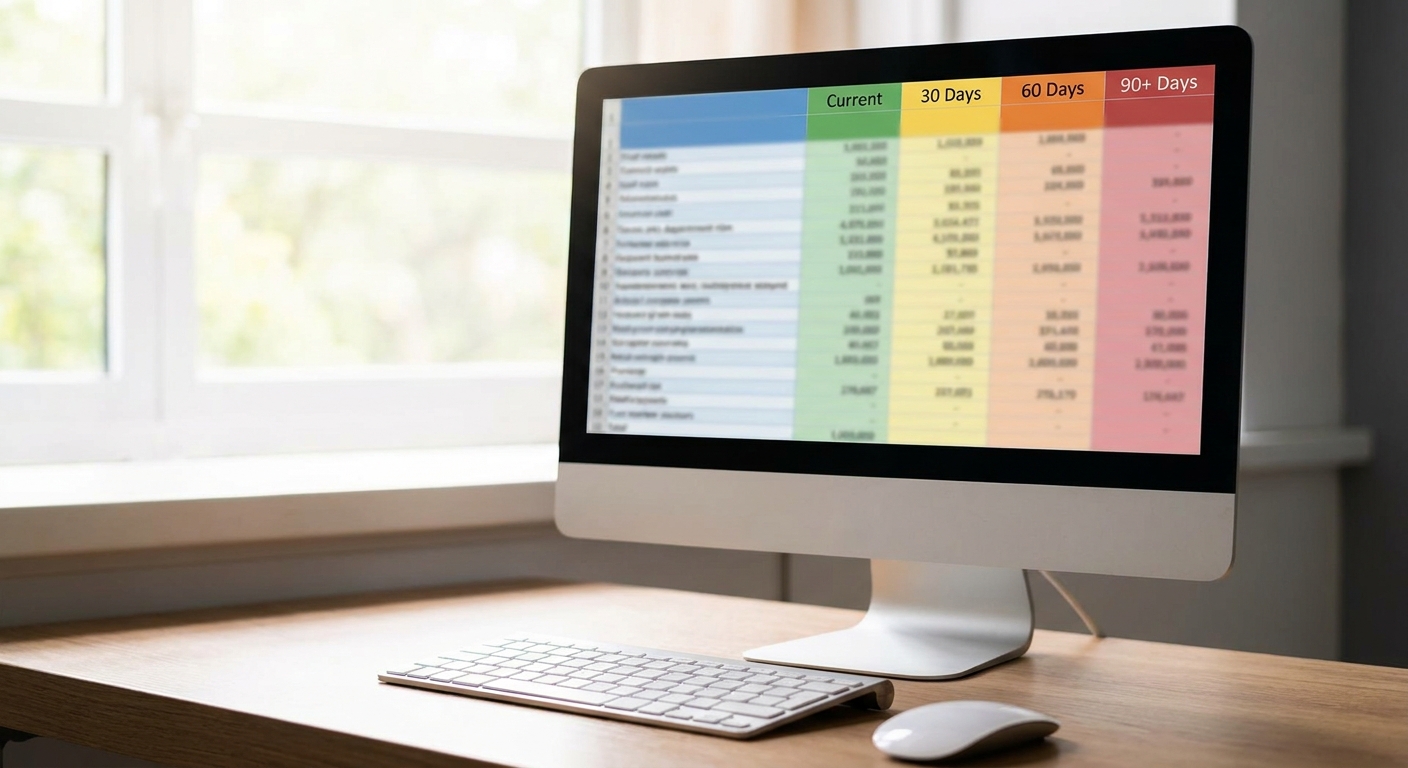
This report lists every unpaid customer invoice and how many days it has been outstanding. We review it monthly to prioritize collection efforts before receivables become uncollectible.
- Current: Invoices not yet due; confirm these match your sales ledger.
- 1-30 days past due: Contact these customers with a friendly reminder to keep cash flowing.
- 31-60 days past due: Escalate follow-up; consider pausing future work until payment is received.
- Over 60 days past due: Evaluate whether a collection agency or write-off may be necessary, but only after exhausting all direct communication.
Accounts Payable Aging Report
The payables aging report shows what the business owes suppliers and when those bills are due. We use it to prioritize payments that preserve supplier relationships and avoid late fees, while protecting cash reserves.
- Due now: Pay these first to avoid service interruptions or penalties.
- Due in 1-30 days: Schedule these payments within the month while keeping enough cash for payroll and taxes.
- Older than 30 days: Review why these are outstanding; unresolved disputes need to be settled before they damage credit terms.
Bank Reconciliation Statement
A bank reconciliation confirms that the cash balance in your accounting system matches the actual bank statement after accounting for outstanding cheques and deposits in transit. We perform this every month because it is the single most effective control against duplicate payments, missing deposits, and unauthorized withdrawals.
- Outstanding items: List cheques written but not yet cleared; follow up if they remain outstanding too long.
- Bank errors and fees: Identify any unexpected bank charges or errors to dispute promptly.
- Unexplained differences: Investigate and resolve any gap between book balance and bank balance; this is often where fraud is first detected.
Performance Analysis and Planning Reports
After the core statements and cash reports, these analytical reports turn raw numbers into forward-looking insights. We use them to compare actual results against the plan, identify trends, and see which parts of the business are driving or dragging performance.

Budget vs Actual Report
This report compares every revenue and expense line to the budget for the month and year-to-date. Variances show where the business is on track and where it is drifting off plan, so you can adjust spending or sales efforts early.
- Favourable variances: Revenue above budget or expenses below budget; investigate whether the cause is sustainable or a one-time event.
- Unfavourable variances: Revenue shortfalls or cost overruns; determine if they are temporary or require a structural change.
- Re-forecast if needed: If actuals consistently miss budget, update the remainder of the year rather than ignoring the plan.
Comparative Year-to-Date Statements
Comparing the current month and year-to-date results to the same period last year reveals trends that a single month might hide. We review these to spot seasonal patterns, measure growth, and catch slow deterioration in margins.
- Revenue trend: Is the business growing at the expected rate when compared with last year?
- Expense trend: Are costs rising faster than revenue? Look for specific line items driving the increase.
- Profit trend: Even if revenue is up, a shrinking net profit margin means the business is working harder for less.
Management Reports by Business Segment
If the business offers multiple products, services, or locations, a segment-level report breaks down revenue and direct costs by each. We build these internal reports because they reveal which segments are truly profitable and which are cross-subsidized by stronger areas.
- Revenue by segment: Rank segments by monthly and year-to-date revenue to focus attention where growth is strongest.
- Gross margin by segment: A segment may have high revenue but a low margin; this is where pricing or cost control can have the biggest impact.
- Overhead allocation: Understand how shared costs affect segment profitability before deciding to invest more or cut back.
We have helped over 1,000 small businesses build monthly financial reporting routines, and we bring that same structured approach to every client relationship.
Key Financial Ratios and KPIs Dashboard
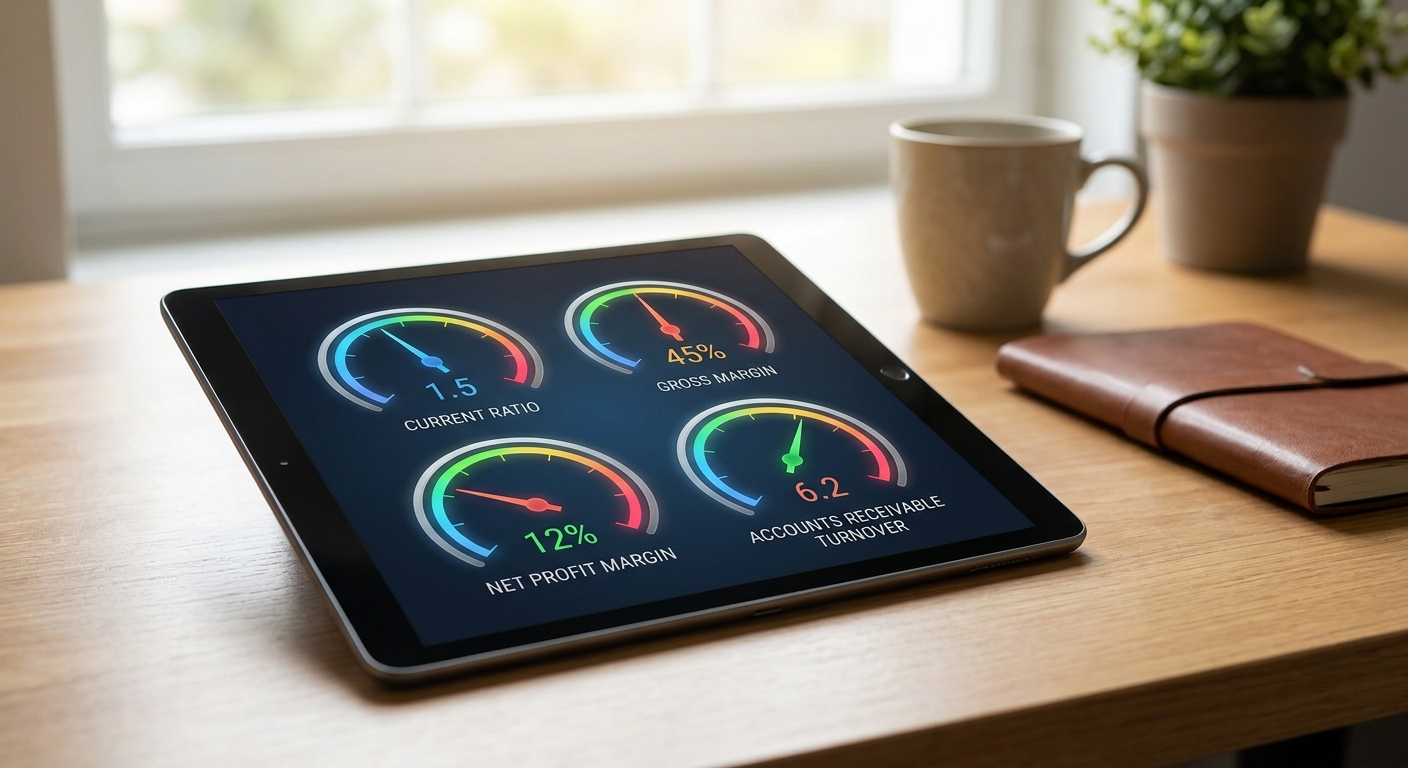
Beyond the formal reports, we track a small set of financial ratios and key performance indicators each month. These quick metrics act as a dashboard, providing an immediate read on liquidity, profitability, and efficiency without digging through every line item.
- Current ratio: Current assets divided by current liabilities; a ratio above 1 indicates the business can cover short-term obligations.
- Gross profit margin: Gross profit divided by revenue; a declining trend signals pressure from costs or pricing.
- Net profit margin: Net profit divided by revenue; this shows how much of each dollar earned becomes actual profit.
- Accounts receivable turnover: How quickly customers pay; a slowing turnover means cash is being tied up longer.
- Debt-to-equity ratio: Total liabilities divided by owner’s equity; a rising ratio means the business is becoming more leveraged and riskier.
We recommend choosing four to six KPIs that align with the business model and reviewing them at the start of every monthly meeting. The dashboard should be customized; a service business may care more about utilization and billable hours, while a product business focuses on inventory turnover and gross margin.
Conclusion
Monthly financial report reviews are not an administrative chore; they are the earliest warning system a business owner has. By consistently reviewing the core statements, cash and reconciliation reports, performance comparisons, and key ratios, you can make decisions with confidence instead of guessing.
We encourage every small business owner to set aside time each month for this review, whether with their team or with an accountant. The businesses that thrive are the ones that see the numbers regularly and act on them. Schedule a one-on-one strategy session with us to start building a monthly reporting routine that fits your business.